Improve swimming performance
by precisely analyzing swimming techniques with data
Swim Analysis
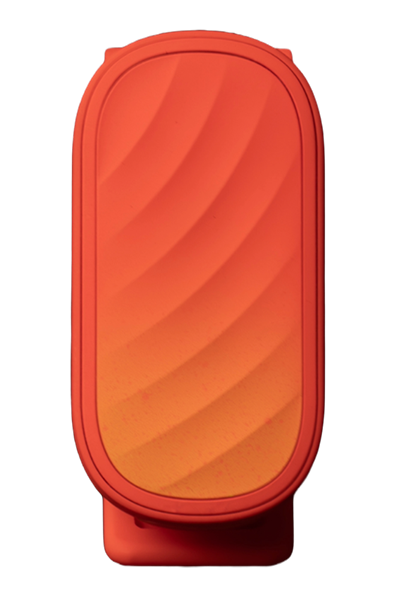
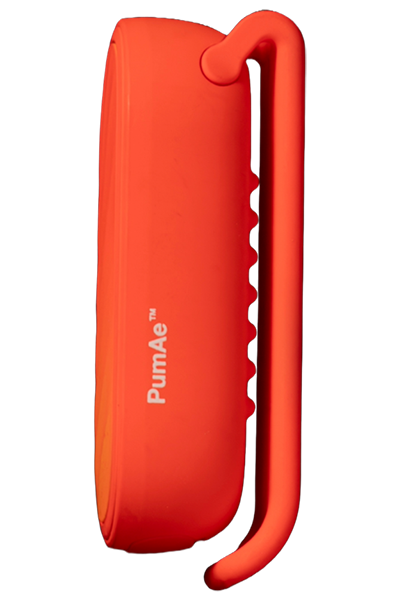
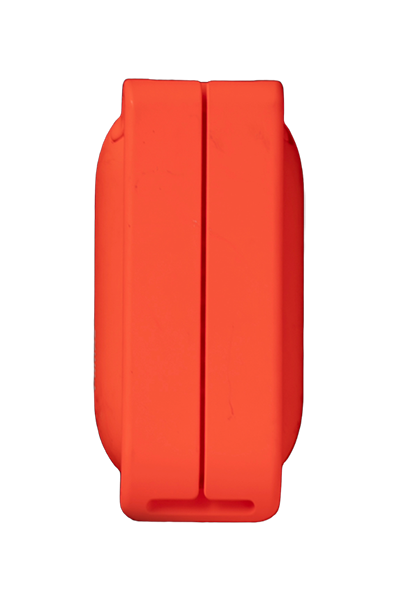
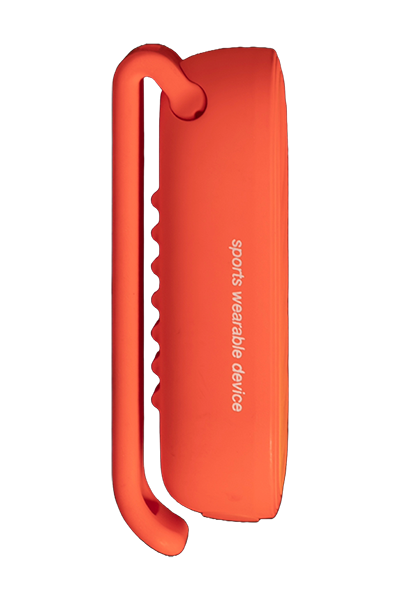
Wearable Device
We provide efficient performance improvement and daily recording content
through wearable devices and apps that monitor swimming movements.
-
NEED
Optimize training intensity based on quantitative data
Need for sports physiology-based periodized training program
The Need for Swimming Records
Swimming records on commercial smartwatches don’t provide enough insight
As the MZ generation's participation in swimming as a form of recreational sports increases, so does their desire for SNS swimming record content.

-
SOLUTION
The Role of Sports Wearable Devices
Data analysis can quantify the details of swimming movements and provide personalized feedback based on this.
A simple feedback tool for your daily swim training
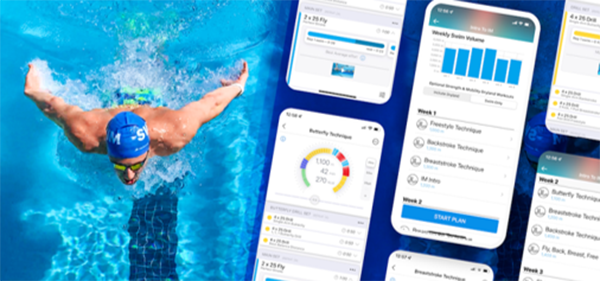
Quantitative data allows for comparison of swimming patterns and
stroke effectiveness across athletes, enabling personalized training.
-
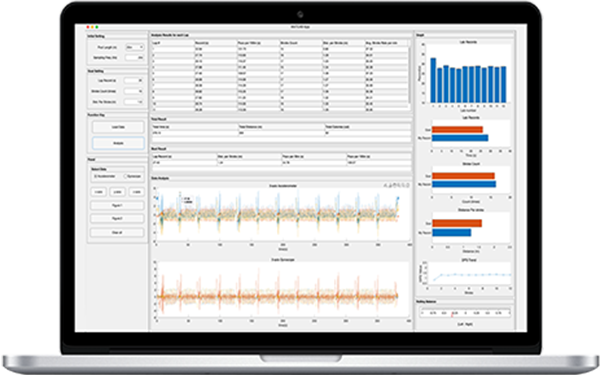
Current) Analysis SW prototype development completed
'Planned to develop mobile app for general public in 2025 -
-
 Provides records by lab
- Record keeping by lab of 25m or 50m
-
 Total workout time and distance
- Provides basic exercise records such as total swimming time, swimming distance, and calories burned
-
 Best record analysis
- Provides best lab times, DPS, 50m and 100m best pace
-
 Wearable and real-time measurement
- Wear it around the middle of your waist to measure each movement
-
 Rolling balance
- Evaluate swimming posture balance by measuring left/right rolling balance
-
 Compare data
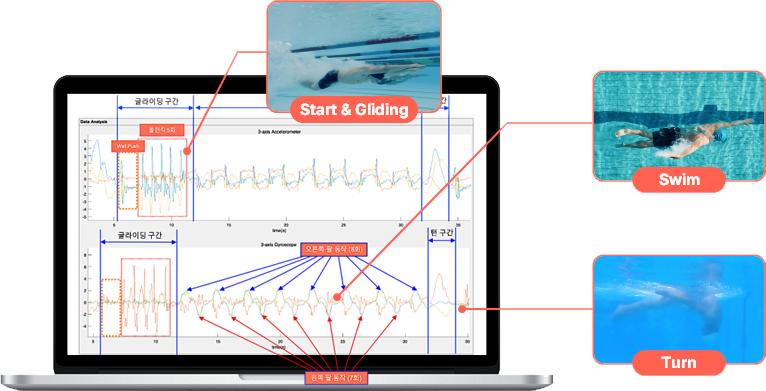
- Zoom in on the desired section of the graph to compare and analyze the main swimming movements, such as start, dive, and turn, between athletes.
-
 Movement pattern analysis
- Visually analyze movement patterns, speed, etc. in each section and use them for coaching.
-
 Stroke rate
- Analyzing swimming speed by Lab by analyzing stroke rate per minute
-
 Face Analysis
- Calculate pace by interval to determine swimmer's pace change rate
-
 Number of strokes per lab
- Analyzing swimming efficiency by measuring stroke count
-
 DPS (distance traveled per stroke)
- Evaluate stroke efficiency by calculating average distance traveled per stroke
-
Quantitative data allows for comparison of swimming patterns and
stroke effectiveness across athletes, enabling personalized training.
-

Current) Analysis SW prototype development completed
'Planned to develop mobile app for general public in 2025 -
Lab-specific records and quantitative analysis examples(Currently in prototype state with no UX/UI design applied)

-
01 Rap record02 Pace by interval03 Number of strokes04 Distance traveled per stroke05 Stroke speed (times/min)06 Swimming efficiency07 Core stability

-
01 Total swimming time02 Total swimming distance03 Total calories consumed04 Average swimming efficiency05 Average core stability

-
01 Best record02 Best DPS03 50M Best Pace04 100M Best Pace05 Best swimming efficiency
Quantitative data allows for comparison of swimming patterns and
stroke effectiveness across athletes, enabling personalized training.
-
Data Detail Analysis Function
Zoom in/out on the graph for each lab for total data to compare and analyze data patterns between players.
Comparison of speed and movement patterns between swimmers during the start, dive, and turn sections
Quantitative data allows for comparison of swimming patterns and
stroke effectiveness across athletes, enabling personalized training.
-

Stable core (less upper and lower body movement)
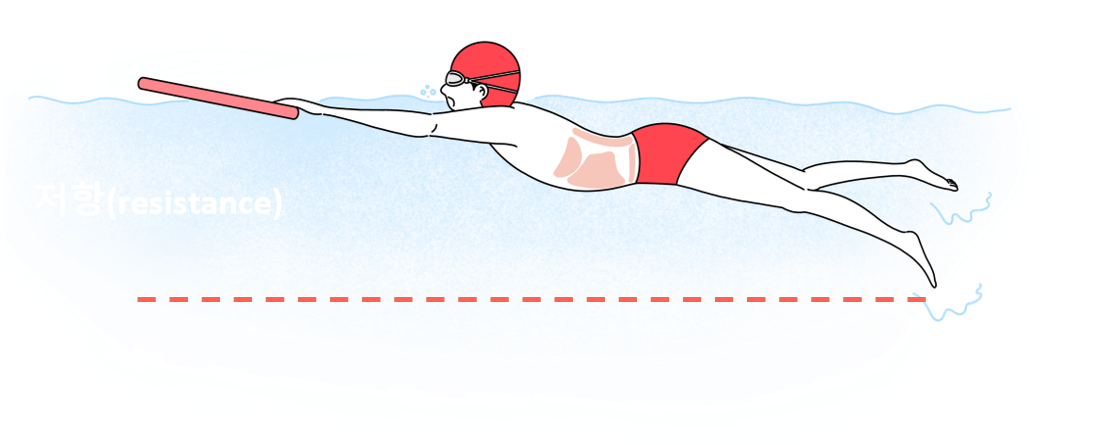
Unstable core (lots of upper and lower body movements)
-
Example of Core Stability Comparison Evaluation(High school female swimmer vs. male swimmer [intermediate to advanced level])
Upper/lower body movements during freestyle swimmer stroke
(red dotted line)
Average : 0.498
Upper/lower body movements during the freestyle stroke for the general public
(red dotted line)
Average : 0.603
Evaluation Results :
During the stroke process, the upper and lower body movements of the general public are more than those of the players, and this can be confirmed through graph patterns and results (players: 0.498 vs. general public 0.603). This can be used to establish a direction for performance improvement by strengthening the core and quantitatively determine the extent of future improvement.
Swim training centers and individual users can improve their performance with data-driven analytics and increase motivation by comparing themselves to professional athletes. Training based on quantity is no longer competitive.
-
Swimming training centers and school swimming clubs
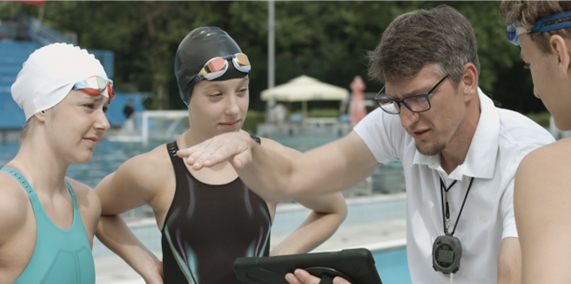
Players and coaches analyze strokes based on data and optimize training programs to achieve greater efficiency in improving performance.
-
Personal user
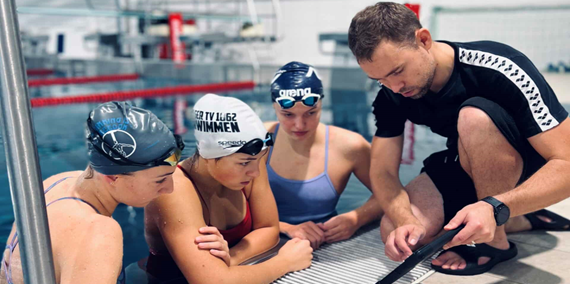
Manage your swimming technique and exercise volume based on data , and increase motivation for areas where you are lacking by comparing it with the swimming technique graphs of professional swimmers.
